In the world of market research, data is essential, but the real game-changer is how effectively you analyze it to extract actionable insights. Enter Excel analysis grids—a tool that not only simplifies data management but also enhances your ability to uncover trends and patterns swiftly.
Clear and Organized Data Entry
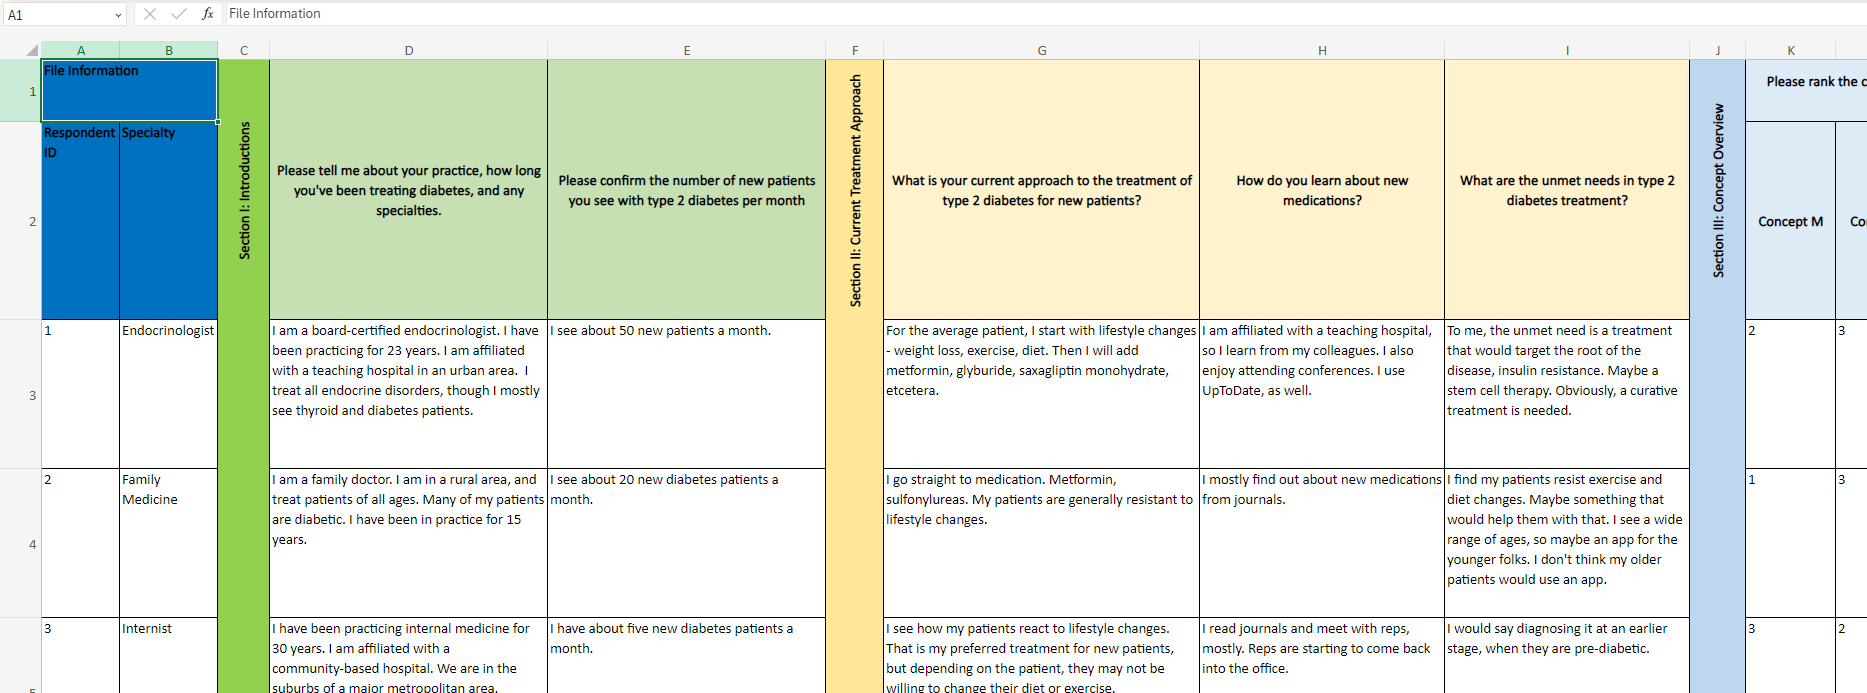
Excel analysis grids offer a streamlined approach to data entry, with the ability to place interview questions across the top row and responses neatly arranged beneath each question. This setup consolidates information into a single document, moving away from the chaos of multiple Word files. The result? A clearer, more manageable view of your data that simplifies both analysis and document management.
Efficient Sorting and Filtering
With Excel, sorting and filtering data becomes a breeze. Want to analyze responses from a specific group, such as nurses? Simply apply a filter to view only their feedback. This functionality is invaluable for managing large datasets and quickly zeroing in on relevant information.
Organized Tabs for Multiple Discussion Guides
If your project involves multiple discussion guides, you can allocate each guide to a separate tab within a single workbook. This organization facilitates easier comparison and quicker analysis of different segments, all while keeping everything within one cohesive document.
Simplified Ranking and Rating Analysis
For questions requiring ranking or rating, create “number only” columns to make it straightforward to view and interpret responses. This setup allows you to quickly assess how respondents rated different statements or stimuli, streamlining the analysis process. We also recommend including a “rationale” column next to the number only column to capture the reason for the rating or ranking.
Versatility for Focus Groups
Excel isn’t just for interviews; it’s also perfect for focus groups. You can input all responses in a single cell for a group or allocate individual lines for each respondent. This flexibility helps in capturing and analyzing focus group data efficiently.
Enhanced Data Management
Excel excels at managing large volumes of data. Its structured format and analytical tools support effective data comparison and trend identification. By consolidating data in a user-friendly manner, Excel makes it easier to achieve clarity and efficiency in your research.
Expert Assistance from SyncScript
Setting up Excel analysis grids and populating them from transcripts can be time-consuming. That’s where SyncScript comes in. We specialize in building customized Excel grids based on your discussion guide, with questions aligned across the top row. We also handle transcription and Excel setup tailored to your specific research needs, saving you valuable time. Plus, we can assist with Excel grids for translations as well!
By organizing data intuitively, SyncScript helps you compare respondents’ answers side by side, ensuring a seamless analysis process. Our simple and effective workbook designs capture all your project data in one clear format, making it easy to search, reference, and analyze.
Achieve Efficiency with Excel Transcripts
We believe that well-organized transcripts are key to efficient market research. Our tools and services streamline the process, providing you with a clear, concise format for all your data. With everything in one place, you can focus on deriving insights and making informed decisions.
Utilizing Excel for market research interviews offers a versatile and efficient approach to data organization, analysis, and collaboration. With its structured format, powerful analytical tools, and collaborative features, Excel is a compelling alternative to traditional Word documents, particularly for managing and interpreting extensive interview data.